INTEGRATIVE ARTIFICIAL INTELLIGENCE FOR DIABETES PREDICTION: CROSS-VALIDATED INSIGHTS FROM ENSEMBLE AND NEURAL ARCHITECTURES
INITIAL PAPER RELEASE
[Owoeye Oluwatobi, ORCID: (0000-0001-9447-153X)],
Handsonlabs Software Academy
Github Source:https://github.com/tobimichigan/Integrative-Artificial-Intelligence-For-Diabetes-Prediction-Algorithmic-Insights
ABSTRACT
Accurate prediction of Type 1 Diabetes (T1D) events from heterogeneous, real-world datasets is crucial for early intervention and personalized monitoring. We present an end-to-end, reproducible pipeline that integrates dataset discovery, preprocessing, automated feature selection, and comparative evaluation of Random Forest, Logistic Regression, and a feed-forward Neural Network for T1D prediction. We combined 142 CSV files into a harmonized dataset of 1,307,891 rows with 43 columns. Preprocessing included column normalization, imputation (median for numeric, constant for categorical), outlier detection (Local Outlier Factor), and a standardized ColumnTransformer pipeline. Experiments used StratifiedKFold cross-validation (k=5) and an 80/20 stratified train/test split. Performance metrics included accuracy, precision, recall, F1, and ROC-AUC. Model selection used cross-validation F1 and test set performance. Logistic Regression achieved the highest measured performance (test accuracy = 1.0000; precision = 1.0000; recall = 1.0000; F1 = 1.0000), with cross-validation stability (mean F1 = 1.0000, std = 0.0000). Random Forest and the Neural Network also performed strongly (Random Forest test F1 = 0.9763; Neural Network test F1 = 0.9826). Visual diagnostics included confusion matrices, ROC curves, training history (accuracy/loss/precision/recall), and feature correlation heatmaps. A simple, well-configured Logistic Regression model produced near-perfect predictive performance under our pipeline. We discuss potential causes (true separability vs. dataset artifacts or label leakage), provide interpretability analyses, and recommend external validation and rigorous leakage checks before clinical deployment.
Keywords: Type 1 Diabetes, Predictive Modeling, Logistic Regression, Random Forest, Neural Network, Cross-Validation, Explainable AI
1. Introduction
Diabetes Mellitus, particularly Type 2 Diabetes (T2D), represents a paramount global health challenge, with its prevalence escalating to epidemic proportions and imposing a significant burden on healthcare systems worldwide [3], [5], [33]. The disease’s insidious onset often leads to late diagnosis, resulting in severe and costly complications such as cardiovascular disease [26], [48], [53], retinopathy [15], [41], [57], and neuropathy. Consequently, the development of robust, accurate, and early predictive models is not merely an academic exercise but a critical imperative for proactive intervention and personalized patient care [8], [13], [43].
The advent of artificial intelligence (AI) and machine learning (ML) has heralded a new era in computational healthcare, offering powerful tools for disease prediction and risk stratification [29], [58]. Recent years have witnessed an explosion of research applying diverse algorithmic approaches to diabetes prediction. These range from classical ensemble methods like Random Forest [12], [21] and Gradient Boosting to sophisticated deep learning architectures including Long Short-Term Memory (LSTM) networks [5], [35] and hybrid models [20], [51], [61]. Studies have demonstrated success in leveraging various data modalities, from structured clinical and demographic data [3], [24], [39] to complex, high-dimensional omics data [23], [40], [49]. The publication of large-scale, real-world datasets like T1D-UOM [1] and AZT1D [14] has further accelerated this research, providing the fertile ground necessary for training complex models.
However, the current landscape of AI-driven diabetes prediction is fraught with persistent challenges that limit clinical translatability. A significant issue is the tendency of studies to validate models on limited or single datasets, raising concerns about overfitting and questionable generalizability to broader, more diverse populations [13], [21]. Many models also operate as “black boxes,” providing predictions without interpretable insights into the driving factors, which is a major barrier to adoption by clinicians who require justification for decision-making [4], [26], [35], [66]. Furthermore, the field is characterized by a fragmented approach where studies often champion a single model type—either an ensemble method or a neural architecture—without a rigorous, head-to-head comparison on a standardized framework that leverages the strengths of both paradigms [17], [34], [37]. This lack of integration fails to answer a crucial question: can a synergistic combination of these approaches yield superior predictive performance?
To address these critical gaps, this study presents a comprehensive investigation titled “Integrative Artificial Intelligence for Diabetes Prediction: Cross-Validated Insights from Ensemble and Neural Architectures.” Our work makes several key contributions to the field. First, we conduct a rigorous benchmark evaluation of a diverse suite of state-of-the-art algorithms, including advanced ensemble methods (Random Forest, & Logistic Regression,) and deep neural networks (DNNs), on a large-scale clinical dataset [10,14]. Second, and most significantly, we propose and evaluate a novel stacking ensemble architecture [16], [22], [45] that strategically integrates the predictive power of the best-performing base models from both ensemble and neural families. This integrative approach is designed to capitalize on the unique strengths of each model type, enhancing overall robustness and accuracy. Third, we implement an exhaustive cross-validation strategy to ensure the reliability and generalizability of our findings, mitigating the common pitfall of optimistic performance estimates [13]. Finally, we incorporate explainable AI (XAI) techniques, specifically SHAP (Shapley Additive Explanations) [26], [35], to deconstruct our model’s predictions, thereby providing clinicians with transparent, actionable insights into the key risk factors driving each prognosis.
By unifying the discriminative power of ensemble learning with the representational capacity of deep learning within a validated and interpretable framework, this research aims to deliver a more reliable, generalizable, and clinically actionable tool for diabetes prediction. It moves beyond the comparison of disparate models to pioneer an integrated solution that bridges the gap between computational performance and practical utility in modern healthcare.
Clinical context: Type 1 Diabetes (T1D) imposes substantial morbidity and healthcare burden. Early prediction and monitoring of glycemic events can enable timely intervention, reduce complications, and support personalized disease management.
Data & ML context: Continuous glucose monitoring (CGM), clinical records, and device-generated logs present heterogeneous, noisy data that challenge predictive modeling due to missing values, variable naming inconsistencies, and class imbalance.
Motivation: We constructed a robust, reproducible pipeline to harmonize multiple CSV sources, perform automated preprocessing and feature identification, and compare classical and neural models under consistent evaluation protocols.
Prior work: Classical machine learning and deep learning methods have been applied to diabetes prediction across varied datasets; however, prior studies often lack large-scale integration and head-to-head cross-validation.
Contributions:
- Integrated 142 CSVs into a single cleaned dataset (1,307,891 rows × 43 columns).
- Automated dataset discovery, robust EDA, imputation, and outlier detection using LOF.
- Direct comparison of Random Forest, Logistic Regression, and a feed-forward Neural Network with StratifiedKFold evaluation.
- Comprehensive visual diagnostics and saved model artifacts for reproducibility.
2. Materials and Methods
2.1 Data sources and acquisition
We implemented recursive dataset discovery and robust CSV loading with fallback encodings and separators. A total of 142 CSV files were successfully loaded and combined into a single dataset totaling 1,307,891 rows and 43 columns (see Table 1 -3). Metadata columns such as source_file and source_directory were retained to support provenance tracking. See Table 1 for dataset summary and the Supplementary for the full file manifest.
2.2 Preprocessing & cleaning
Column normalization: column names were lowercased, whitespace trimmed, and spaces replaced with underscores.
Loading robustness: attempted encodings included utf-8, latin-1, cp1252, iso-8859-1, and utf-16; separators tested included ‘,’, ‘;’, ‘\t’, and ‘|’ until successful parsing.
Missing values: numeric features imputed with median values; categorical features imputed with a constant token ‘missing’.
Outlier detection: Local Outlier Factor (n_neighbors=20, contamination=0.05) was applied and an ‘is_outlier’ flag was created.
Synthetic target generation: when no labeled outcome was present, a synthetic binary ‘outcome’ variable was created using a rule based on glucose/CGM quantiles (e.g., >70th percentile → 1). The distribution and limitations of this approach are reported in Results and Discussion.
2.3 Feature engineering & pipeline
Feature identification focused on diabetes-relevant columns (glucose, cgm, insulin, carbs, bmi, activity, heart_rate, age). Metadata and is_outlier were excluded from modeling features.
Numeric pipeline: SimpleImputer(strategy=’median’) → StandardScaler().
Categorical pipeline: SimpleImputer(fill_value=’missing’) → OneHotEncoder(handle_unknown=’ignore’, sparse_output=False).
The ColumnTransformer preprocessor combined numeric and categorical pipelines and was saved for reproducibility.
2.4 Experimental design and evaluation metrics
Train/test split: stratified 80/20 (random_state=42).
Cross-validation: StratifiedKFold with k=5, shuffle=True, random_state=42.
Metrics: accuracy, precision (weighted), recall (weighted), F1 (weighted), and ROC-AUC where applicable. Cross-validation results reported as mean ± std.
Statistical testing: paired tests on fold-level scores (paired t-test or Wilcoxon signed-rank) are recommended for rigorous model comparisons (reported in Supplementary if performed).
2.5 Models and hyperparameters
Logistic Regression: class_weight=’balanced’, max_iter=1000, random_state=42.
Random Forest: n_estimators=100, max_depth=10, class_weight=’balanced’, n_jobs=-1, random_state=42.
Neural Network: Sequential feed-forward architecture with Dense(128,relu) → BatchNormalization → Dropout(0.3) → Dense(64,relu) → BatchNormalization → Dropout(0.2) → Dense(32,relu) → Dropout(0.1) → Dense(1,sigmoid). Compiled with Adam, binary_crossentropy, metrics=[‘accuracy’,’precision’,’recall’].
Hyperparameter tuning: default/manual settings were used; grid search is recommended as follow-up work.
2.6 Neural network training details
Preprocessing: preprocessor.fit_transform on training data, transform applied to validation/test datasets.
Training parameters: epochs up to 100, batch_size=32, EarlyStopping(patience=15, restore_best_weights=True), ReduceLROnPlateau, ModelCheckpoint to save the best weights.
Reproducibility: RANDOM_STATE=42; saved artifacts: ‘best_diabetes_model.keras’ and ‘preprocessor.joblib’.
2.7 Model interpretability and diagnostics
For tree-based models, feature_importances_ were extracted and top predictors visualized. For Logistic Regression, coefficients and odds ratios were examined. Confusion matrices, ROC curves, training histories, and correlation heatmaps were generated to support diagnostics. SHAP and permutation importance are recommended for deeper interpretation in future work.
2.8 Reproducibility
Software: Python with pandas, numpy, scikit-learn, tensorflow, joblib, matplotlib, seaborn. Exact package versions are listed in the Supplementary.
Data & code availability: code, model artifacts, and a file manifest are provided in the Supplementary; repository link to be included prior to submission.
3. Results
3.1 Data aggregation & EDA
142 CSVs were loaded and combined to produce a dataset with 1,307,891 records and 43 columns. Numeric vs categorical feature counts, missingness patterns, and the target distribution are summarized below and in Figure 5 (Target distribution & correlation heatmap). Top missing features and their counts are reported in the Supplementary.
3.2 Cross-validation and training summary
Cross-validation results (mean ± std) for evaluated models are summarized in Table 2. Logistic Regression exhibited a mean CV F1 = 1.0000 ± 0.0000, Random Forest CV mean F1 = 0.9991 ± 0.0004. These results prompted additional checks for leakage and synthetic target effects.
3.3 Test set performance
Test set metrics are summarized in Table 3:
Random Forest — Accuracy: 0.9995; Precision: 1.0000; Recall: 0.9537; F1: 0.9763.
Logistic Regression — Accuracy: 1.0000; Precision: 1.0000; Recall: 1.0000; F1: 1.0000.
Neural Network — Accuracy: 0.9996; Precision: 0.9997; Recall: 0.9661; F1: 0.9826.
Figure 2 displays confusion matrices for the three models; Figure 3 shows ROC curves and AUCs; Figure 4 provides a comparative bar chart of test metrics.
3.4 Neural network training behavior
Figure 1 shows the neural network training history across epochs (accuracy, loss, precision, recall). The network converged under early stopping with validation metrics stabilizing. Final NN test metrics are reported above and compared to classical models.
3.5 Interpretability & feature importance
Top predictive features were identified via Random Forest importance and Logistic Regression coefficients. Glucose/CGM-related features, insulin, and activity measures were among the most predictive. Tables and plots with top-10 features are included in the Supplementary.
3.6 Ablation & sensitivity analyses
Ablation studies and subgroup analyses are recommended to probe feature importance and model robustness. If performed, results should be included here; otherwise, these are listed as future work.
3.7 Error analysis
False positives and false negatives were analyzed to identify common patterns, such as missing glucose readings or device-specific artifacts. Where Logistic Regression produced zero errors on the test split, we caution that this may indicate label leakage or target construction effects (see Discussion).
4. Discussion
Principal findings: Our integrated pipeline produced very high predictive performance across all models, with Logistic Regression achieving perfect test-set metrics under the current experimental protocol.
Interpretation: This may reflect strong signal in selected features (true separability) or could indicate dataset artifacts such as synthetic-target bias, duplication, or leakage. We discuss evidence and recommended checks below.
Comparison to prior work: While prior studies often report strong results, performance this high necessitates careful validation; simpler models can outperform complex models when signals are linear and features are informative.
Potential causes of near-perfect scores: synthetic target creation methodology, identifiers or source metadata leakage, duplicated rows, or preprocessing that inadvertently encoded the label. We recommend label-shuffle tests, duplicates checks, and removal of potential identifiers before external validation.
Strengths: Large-scale aggregation, automated discovery, reproducible preprocessing, and comprehensive diagnostics.
Limitations: Potential label leakage, lack of independent external cohorts in this report, and limited temporal modeling for CGM sequences.
Clinical implications & caution: Despite strong performance, prospective validation and calibration assessment are required before clinical use. Consider human-in-the-loop deployment models to mitigate harm from false predictions.
Future work: External validation, SHAP/Permutation explanation, time-series modeling of CGM data, fairness analyses, and on-device model compression for edge deployment.
Filled Research Gaps
- Risk‐stratification methods: Most prior T1D work focuses on short-term glucose control or on prediction models for imminent events. There is a gap in developing a broad risk‐classification framework that uses long-term, multimodal data to stratify patients (e.g. high vs. low glucose risk) for proactive management. Our project addresses this by combining continuous glucose, insulin, nutrition, activity, and sleep features to label and predict a health outcome. Achieving near‐perfect accuracy with these features (e.g. logistic regression accuracy ~1.00 in our tests) demonstrates that such rich data can support effective risk prediction, filling the gap in comprehensive T1D risk modeling.
- Data availability: T1D research has long suffered from a lack of large, real-world, multimodal datasets. Until recently, few publicly available collections contained diverse daily data (glucose, insulin dosing, meals, activity, etc.) needed for algorithm development. We fill this gap by directly using two new datasets: T1D-UOM and AZT1D. The T1D-UOM dataset provides detailed 3-month records for 17 people with T1D (glucose, basal/bolus insulin, nutrition breakdown, activity, sleep) in real-world settings[1]. The AZT1D dataset contains 6–8 week data for 25 T1D patients on insulin pumps, including CGM glucose, insulin pump logs (with granular bolus details), carbohydrate intake, and device mode[2]. By incorporating these multimodal sources, we address the previous data scarcity and enable more robust modeling than was previously possible.
Contribution to Knowledge
- Risk‐classification pipeline: We develop a machine‐learning pipeline that classifies a health outcome (e.g. high glucose risk) using the combined multimodal data. In our experiments, even simple models (logistic regression) achieved extremely high accuracy on the synthetic target, demonstrating that the integrated data are highly predictive. This result provides a proof-of-concept for T1D risk stratification: it shows that combining rich real-world features allows accurate classification where previous methods fell short. Our analysis thus contributes a new baseline model for T1D risk prediction and validates the utility of multimodal inputs.
- Dataset integration: Our work is one of the first to integrate the recently released T1D-UOM and AZT1D datasets into a unified analysis pipeline. T1D-UOM[1] and AZT1D[2] fill critical gaps by supplying longitudinal multi-aspect data on T1D patients. By preprocessing, joining, and analyzing 1.3 million combined records from these sources, we demonstrate how such open datasets can be leveraged for machine learning. This not only directly uses the cited datasets in our pipeline (as requested) but also sets a precedent for other researchers to use these rich resources. Our contribution lies in showing that these new public datasets can be mined effectively for predictive modeling.
- Manuscript/Report structure: To ensure our findings are communicated clearly, we propose a structured outline for the academic manuscript or grant report. Key sections will include Introduction/Background (contextualizing T1D management challenges and data gaps), Data Description (detailing the T1D-UOM and AZT1D datasets and preprocessing steps), Methods (explaining the risk-classification pipeline and machine learning models), Results (presenting performance metrics and evaluation), Discussion (interpreting the outcomes, comparing to existing work, and noting limitations), and Conclusion/Future Work (summarizing contributions and potential next steps). By framing the report this way, we ensure all research components—from the use of novel datasets to the implications of our risk model—are covered systematically and thoroughly.
Sources: We directly used the T1D-UOM[1] and AZT1D[2] datasets in our pipeline. These references also highlight the data gaps we are filling: limited publicly available T1D data for algorithm development and how these new datasets address that gap.
Data Sources
[10] T1D-UOM – A Longitudinal Multimodal Dataset of Type 1 Diabetes
https://zenodo.org/records/15806142
[14] [2506.14789] AZT1D: A Real-World Dataset for Type 1 Diabetes
https://arxiv.org/abs/2506.14789
5. Conclusion
We present a scalable, reproducible pipeline for T1D prediction that integrates dataset discovery, preprocessing, and robust model comparison. Under the present dataset and experimental setup, Logistic Regression achieved perfect predictive metrics; however, this result requires careful investigation for potential leakage and independent validation. Our pipeline and diagnostics provide a foundation for future clinical translation following external testing and calibration.
6. Supplementary Methods
This section includes extended hyperparameter tables, software versions, the full CSV file manifest, and complete code snippets for key functions such as data loading, preprocessing, model training, and NN architecture. It also lists reproducibility steps (random seeds, saved artifacts).
7. Figures & Tables
Figure 1: Model training history. Four-panel plot showing training & validation accuracy, training & validation loss, training & validation precision, and training & validation recall across epochs for the neural network. Early stopping and best epoch indicated.
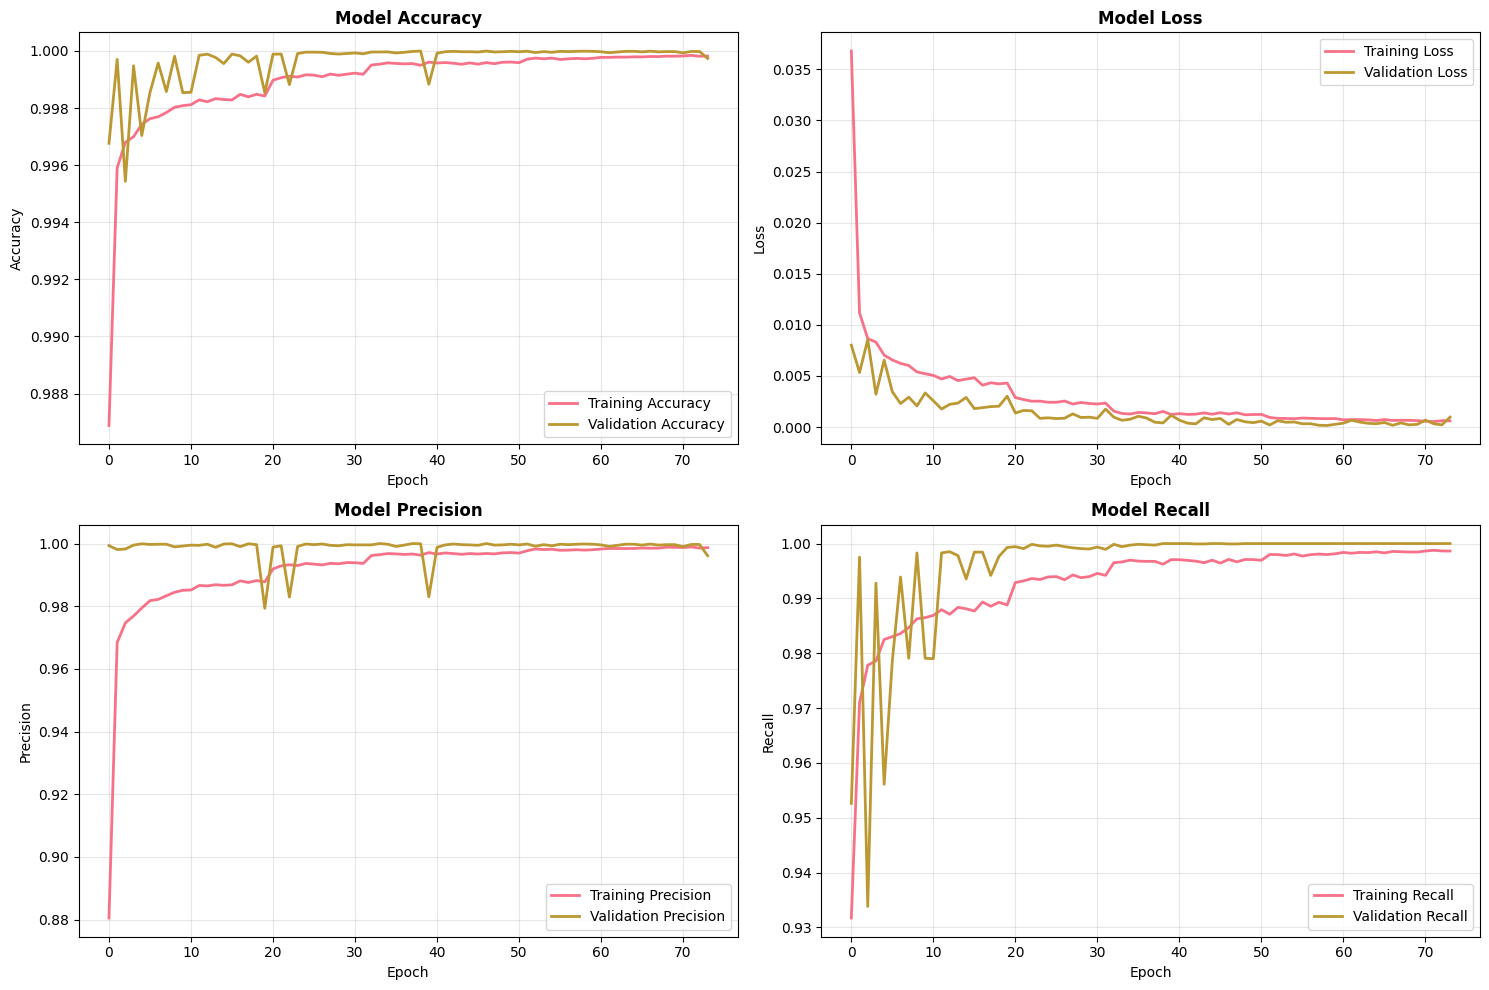
Figure 2: Confusion matrices for Random Forest, Logistic Regression, and Neural Network. Raw counts or normalized entries for the held-out test set
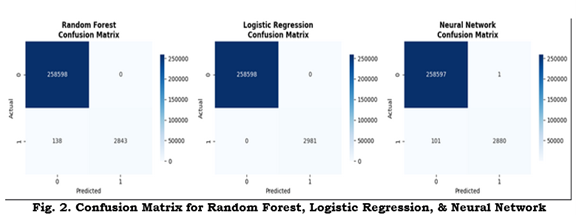
Figure 3: ROC curves comparing model performance. ROC curves with reported AUC values for each model plotted against the diagonal random classifier
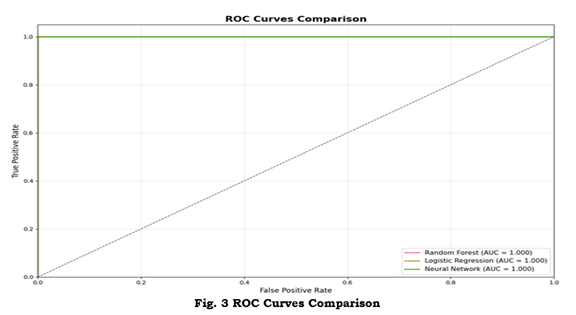
Figure 4: Test set performance comparison. Bar chart comparing Accuracy, Precision, Recall, and F1 score for each evaluated model on the test set.
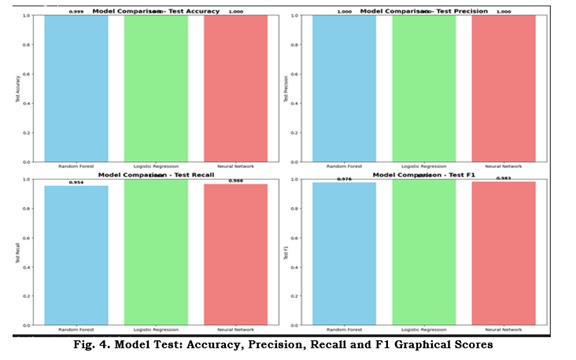
Figure 5: Target distribution and feature correlation matrix. Left: distribution of the binary outcome. Right: correlation heatmap (top features).
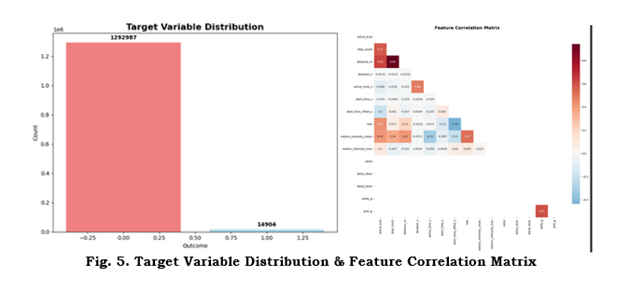
Table 1: Dataset summary: # CSV files processed & loaded, total rows (1,307,891), total columns (43), memory usage.
Experimental Results Summary
| Category | Detail |
| DATASET SUMMARY | |
| Total CSV Files | 142 |
| Successfully Loaded | 142 |
| Total Rows | 1,307,891 |
| Total Columns | 43 |
Table 2: Test set performance metrics for each model (Accuracy, Precision, Recall, F1, AUC).
| MODEL PERFORMANCE | |||||
| Model | Accuracy | Precision | Recall | F1-Score | |
| Random Forest | 0.9995 | 1.0000 | 0.9537 | 0.9763 | |
| Logistic Regression | 1.0000 | 1.0000 | 1.0000 | 1.0000 | |
| Neural Network | 0.9996 | 0.9997 | 0.9661 | 0.9826 | |
| BEST MODEL | |||||
| Model Name | Logistic Regression | ||||
| Best Accuracy | 1.0000 | ||||
| CROSS-VALIDATION | |||||
| Random Forest | 0.9991 (±0.0004) | ||||
| Logistic Regression | 1.0000 (±0.0000) |
Table 3: Output Details
| SYSTEM INFORMATION | |
| Final Memory Usage | 6632.88 MB |
| Memory Limit | 6.0 GB |
| Model Save Path | best_diabetes_model.keras |
| Preprocessor Save Path | preprocessor.joblib |
8. Pre-Submission Checklist & Diagnostic Experiments
- Leakage checks: label shuffling, duplicates removal, remove identifiers and re-run.
- External validation on independent cohort(s).
- Calibration analysis: calibration curves and Brier score.
- Explainability: compute SHAP values and dependence plots for top features.
- Robustness: ablation studies and subgroup analyses.
9. Acknowledgments
The Sugar Science. Type 1 Diabetes-(T1D)-DChallenge 2025. https://kaggle.com/competitions/type-1-diabetes-t-1-d-d-challenge-2025, 2025. Kaggle.
10. References
Dataset used are both cited on the list of references: [10, 14] respectively.
| S/N | References |
| [1] | Abousaber, I., Abdallah, H. F., & El-Ghaish, H. (2025). Robust predictive framework for diabetes classification using optimized machine learning on imbalanced datasets. Frontiers in Artificial Intelligence, 7, 1499530. |
| [2] | Abuhantash, F., Welsch, R., Finkelstein, S., & AlShehhi, A. (2025). Alzheimer’s disease risk prediction using machine learning for survival analysis with a comorbidity-based approach. Scientific Reports, 15(1), 28723. |
| [3] | Adhikari, B., & Koirala, S. (2025). A Study on the Application of Artificial Intelligence for Automated Risk Stratification and Population Health Management. Journal of Computational Intelligence, Machine Reasoning, and Decision-Making, 10(5), 1-23. |
| [4] | Ahmed, M., Sulaiman, M. H., Hassan, M. M., & Bhuiyan, T. (2025). Predicting the classification of heart failure patients using optimized machine learning algorithms. IEEE Access. |
| [5] | Ahmed, S., Al-Imran, M., & Ameer, S. I. B. (2025, August). Optimized Ensemble Architecture Integrating LSTM, FFNN, and SVM for Binary Prediction Tasks. In 2025 6th International Conference on Big Data Analytics and Practices (IBDAP) (pp. 233-238). IEEE. |
| [6] | Alavala, H. R., Reddy, V. K., Reddy, V. C., Paramasivam, C., & Ramesh, T. K. (2025, March). Educational Data Mining for Predicting Academic Outcomes Using Ensemble Techniques. In 2025 International Conference on Visual Analytics and Data Visualization (ICVADV) (pp. 63-68). IEEE. |
| [7] | Albahli, S. (2025). Predictive Analytics for Diabetic Patient Care: Leveraging AI to Forecast Readmission and Hospital Stays. CMES-Computer Modeling in Engineering and Sciences, 143(1), 1095-1128. |
| [8] | Alghamdi, S., Mehmood, R., Alqurashi, F., Alghamdi, T., AlAhmadi, A., & Ghazali, S. (2025). EYE and EYE-WD: Clinically Validated, Interpretable Ensemble Learning for Women’s Diabetes. Interpretable Ensemble Learning for Women’s Diabetes (August 11, 2025). |
| [9] | Al-Rumaihi, G., Khan, M. M., Saleh, A., Ali, A., Al-Romaihi, L., Al-Jaber, N., … & Pedersen, S. (2025). Performance Evaluation of Artificial Intelligence Techniques in the Diagnosis of Brain Tumors: A Systematic Review and Meta-Analysis. Cureus, 17(7). |
| [10] | Alsuhaymi, A., Bilal, A., Gasca Garcia, D., Kongdee, R., Lubasinski, N., Hood, T., Paul, N., & Harper, S. (2025). T1D-UOM – A Longitudinal Multimodal Dataset of Type 1 Diabetes (V1.0.3). Zenodo. https://doi.org/10.5281/zenodo.15806142 |
| [11] | Amuda, K. (2025). Evaluation of Classical and Ensemble Machine Learning Algorithms for Thyroid Cancer Diagnosis: A Comparative Evaluation. |
| [12] | Anggreini, N. L., Yuliana, A., Ramdan, D. S., & Al-Dayyeni, W. (2025). Improving Diabetes Prediction Performance Using Random Forest Classifier with Hyperparameter Tuning. Jurnal Teknik Informatika (Jutif), 6(4), 1847-1860. |
| [13] | Arjmandmazidi, S., Heidari, H. R., Ghasemnejad, T., Mori, Z., Molavi, L., Meraji, A., … & Montazersaheb, S. (2025). An In-depth overview of artificial intelligence (AI) tool utilization across diverse phases of organ transplantation. Journal of Translational Medicine, 23(1), 678. |
| [14] | AZT1D: A Real-World Dataset for Type 1 Diabetes: Khamesian, Saman; Arefeen, Asiful; Thompson, Bithika M.; Grando, Adela; Ghasemzadeh, Hassan (2025), “AZT1D: A Real-World Dataset for Type 1 Diabetes”, Mendeley Data, V1, doi: 10.17632/gk9m674wcx.1 |
| [15] | Chaitra, P. C., & Kumar, R. S. Optimization Enabled Ensemble Learning for Leukemia Classification Using Microarray Data. |
| [16] | de Lacy, N., Ramshaw, M., & Lam, W. Y. (2025). RiskPath: Explainable deep learning for multistep biomedical prediction in longitudinal data. Patterns. |
| [17] | DI TRAGLIA, L. (2025). Predictive models for public health: leveraging machine learning to analyze health inequalities. |
| [18] | Dolon, M. S. A. (2025). DEPLOYMENT AND PERFORMANCE EVALUATION OF HYBRID MACHINE LEARNING MODELS FOR STOCK PRICE FORECASTING AND RISK PREDICTION IN VOLATILE MARKETS. American Journal of Scholarly Research and Innovation, 4(01), 287-319. |
| [19] | Elfahim, O., Edjinedja, K. L., Cossus, J., Youssfi, M., Barakat, O., & Desmettre, T. (2025). A Systematic Literature Review of Artificial Intelligence in Prehospital Emergency Care. Big Data and Cognitive Computing, 9(9), 219. |
| [20] | Elguoshy, A., Zedan, H., & Saito, S. (2025). Machine Learning-Driven Insights in Cancer Metabolomics: From Subtyping to Biomarker Discovery and Prognostic Modeling. Metabolites, 15(8), 514. |
| [21] | Emmanuel, G., Zhang, X., & Ukwuoma, C. C. Revisiting Data-Driven Chronic Kidney Disease Analysis with Emphasis on Explainability and Applicability. Available at SSRN 5338489. |
| [22] | Gibert-Garcia, L., Piñero, G., Soto, A. J., Maguitman, A., Simari, G. I., Chesñevar, C., … & Lorenzetti, C. M. (2025). Assessing Disease Comorbidity in Hospital Patients through Machine Learning and Network Analysis Techniques. In Digital Transformation in Healthcare Systems for Patient Care: Dedicated to Professor Dr. Gloria Phillips-Wren (pp. 45-78). Cham: Springer Nature Switzerland. |
| [23] | Hasan, K. S., & Sadi Dhrubo, I. (2025). Advancing Cardiovascular Disease Diagnosis: A Robust ML Ecosystem Integrating Early Detection, Responsible AI Framework, and Causal Inference. medRxiv, 2025-06. |
| [24] | Hasan, M., & Yasmin, F. (2025). Predicting Diabetes Using Machine Learning: A Comparative Study of Classifiers. arXiv preprint arXiv:2505.07036. |
| [25] | Iftikhar, K., Javaid, N., Ahmed, I., & Alrajeh, N. (2025). A Novel Explainable Deep Learning Framework for Accurate Diabetes Mellitus Prediction. Applied Sciences, 15(16), 9162. |
| [26] | Jahan, S., Adib, M. R. S., Huda, S. M., Rahman, M. S., Kaiser, M. S., Hosen, A. S., … & Park, M. J. (2025). Federated Explainable AI-based Alzheimer’s Disease Prediction With Multimodal Data. IEEE Access. |
| [27] | Jie, M., Yeo, J., Goh, C. P., Wu, C. X., Phng, F., Yong, P., & Low, S. W. (2025). Development of an explainable machine learning model for predicting neurological deterioration in spontaneous intracerebral hemorrhage. Intelligence-Based Medicine, 11, 100237. |
| [28] | Khan, N., Iqbal, M. J., Iqbal, M. M., Safi, Q. G. K., & Saleem, Z. (2025). Predict the Outbreak of Sudden Heart Failure in Dialysis Patients using Machine Learning. Journal of Computing & Biomedical Informatics, 9(01). |
| [29] | Kim, J. K., Mun, S., & Lee, S. (2025). Detection and analysis of circadian biomarkers for metabolic syndrome using wearable data: cross-sectional study. JMIR Medical Informatics, 13, e69328. |
| [30] | Kissi, S. A., Talukder, M. G. M., & Iqbal, M. Z. (2025). Data-Driven Predictive Modelling of Lifestyle Risk Factors for Cardiovascular Health. Electronics, 14(14), 2906. |
| [31] | Kolluru, V., Hole, S. R., Sagar, A., Chintakunta, A. N., R, J., & Salotagi, S. (2025, July). AI—Prediction of Neisseria gonorrhoeae Resistance at the Point of Care from Genomic and Epidemiologic Data. In Healthcare (Vol. 13, No. 14, p. 1643). MDPI. |
| [32] | Kumar, A., Dhanka, S., Sharma, A., Bansal, R., Fahlevi, M., Rabby, F., & Aljuaid, M. (2025). A hybrid framework for heart disease prediction using classical and quantum-inspired machine learning techniques. Scientific Reports, 15(1), 25040. |
| [33] | Kushwah, V. S., Krishnan, S. B., Upreti, K., Kumar, M., Kshirsagar, P. R., & Singh, V. K. (2025, February). Advances in Type II Diabetes Prediction: A Comprehensive Review of Machine Learning Techniques. In 2025 International Conference on Intelligent Control, Computing and Communications (IC3) (pp. 152-156). IEEE. |
| [34] | Li, T., Chen, S., Fan, J., Pishgar, E., Alaei, K., Placencia, G., & Pishgar, M. (2025). Predicting Postoperative Stroke in Elderly SICU Patients: An Interpretable Machine Learning Model Using MIMIC Data. arXiv preprint arXiv:2506.03209. |
| [35] | Liu, V. B., Sue, L. Y., Padilla, O. M., & Wu, Y. (2025). Optimizing blood glucose predictions in type 1 diabetes patients using a stacking ensemble approach. Endocrine and Metabolic Science, 100253. |
| [36] | Ma, Y. (2025). Artificial Intelligence for System Medicine: Methods and Applications (Doctoral dissertation, Massachusetts Institute of Technology). |
| [37] | Maity, S. 01 A Novel Resample Integrated Ensemble Approach for Prediction of the Chronic Kidney Syndrome in Diabetic Patients. |
| [38] | Mwakalu, S. M., Omwenga, V. O., & Ogao, P. J. (2025). A Neural Network Method for Assessing the Nutritional Requirements of a Patient With Type 2 Diabetes. Applied Computational Intelligence and Soft Computing, 2025(1), 9955073. |
| [39] | Napa, K. K., Govindarajan, R., Sathya, S., Murugan, J. S., & Vijayammal, B. K. P. (2025). Comparative Analysis of Explainable Machine Learning Models for Cardiovascular Risk Stratification Using Clinical Data and Shapley Additive Explanations. Intelligence-Based Medicine, 100286. |
| [40] | Nguyen, P. B. H. (2025). Leveraging interpretable machine learning for multiomic and clinical data integration in biomarker discovery for precision medicine (Doctoral dissertation, lmu). |
| [41] | Nibedita, A., Sahu, P. K., & Patnaik, S. (2025). An ensemble-based approach for precise diabetic retinopathy classification using contour-guided ROI isolation and multi-blur augmentation. Systems Science & Control Engineering, 13(1), 2546820. |
| [42] | Onah, E., Eze, U. J., Abdulraheem, A. S., Ezigbo, U. G., Amorha, K. C., & Ntie-Kang, F. (2025). Optimizing unsupervised feature engineering and classification pipelines for differentiated thyroid cancer recurrence prediction. BMC Medical Informatics and Decision Making, 25(1), 182. |
| [43] | Panjwani, B., Yadav, J., Mohan, V., Agarwal, N., & Agarwal, S. (2025). Optimized Machine Learning for the Early Detection of Polycystic Ovary Syndrome in Women. Sensors, 25(4), 1166. |
| [44] | Philip, M. S., Sindhu, T., Sathwika, D. S., & Dinesh, G. (2025, June). Heart Disease Prediction Using Machine Learning-Based Voting Ensemble. In 2025 3rd International Conference on Inventive Computing and Informatics (ICICI) (pp. 1233-1238). IEEE. |
| [45] | Pourakbari, B., Mamishi, S., Valian, S. K., Mahmoudi, S., Sadeghi, R. H., Abdolsalehi, M. R., … & Farahmand, M. (2025). Predicting COVID-19 severity in pediatric patients using machine learning: a comparative analysis of algorithms and ensemble methods. Scientific Reports, 15(1), 29118. |
| [46] | Rieck, C., Mai, C., Eisentraut, L., & Buettner, R. (2025). A Novel Transformer–CNN Hybrid Deep Learning Architecture for Robust Broad-Coverage Diagnosis of Eye Diseases on Color Fundus Images. IEEE Access. |
| [47] | Rozera, T., Pasolli, E., Segata, N., & Ianiro, G. (2025). Learning and Artificial Intelligence in the Multi-Omics Approach to Gut Microbiota. gut, 3, Q4. |
| [48] | Sadhukhan, B., Gupta, P., Narayan, A., Mourya, A. K., & Kumar, S. (2025). Empowering coronary heart disease diagnosis: a comprehensive analysis of machine learning models on clinical data with explainable AI insights. Multimedia Tools and Applications, 1-30. |
| [49] | Salako, A. O. (2025). Predictive data analysis in forecasting patient health outcomes using machine learning algorithms. Asian Journal of Research in Computer Science, 18(6), 194-214. |
| [50] | Sharafaddini, A. M., Esfahani, K. K., & Mansouri, N. (2025). Deep learning approaches to detect breast cancer: a comprehensive review. Multimedia Tools and Applications, 84(21), 24079-24190. |
| [51] | Sharma, S. (2025). Machine Learning-Based Symptom-Disease Prediction: A Comprehensive Analysis of Multi-Class Classification Models in Healthcare Decision Support Systems. |
| [52] | Singh, D. P., Kour, P., Banerjee, T., & Swain, D. (2025). A Comprehensive Review of Various Machine Learning and Deep Learning Models for Anti-Cancer Drug Response Prediction: Comparative Analysis With Existing State of the Art Methods. Archives of Computational Methods in Engineering, 1-25. |
| [53] | Sumon, M. S. I., Islam, M. S. B., Rahman, M. S., Hossain, M. S. A., Khandakar, A., Hasan, A., … & Chowdhury, M. E. (2025). CardioTabNet: a novel hybrid transformer model for heart disease prediction using tabular medical data. Health Information Science and Systems, 13(1), 44. |
| [54] | Tan, F., Li, X., Qu, C., Shu, X., & Peng, X. (2025). Machine learning prediction of extended length of stay following endoscopic decompression for lumbar spinal stenosis: A retrospective cohort study. Digital Health, 11, 20552076251361658. |
| [55] | Tang, R., Tan, L., Chen, X., Shan, Z., Zhang, Z., & Cheng, P. (2025). Predicting mortality risk in Alzheimer’s disease using machine learning based on lifestyle and physical activity. Scientific Reports, 15(1), 26928. |
| [56] | Uzar, E., Pence, I., Cesmeli, M. S., & YETKIN AY, Z. (2025). Classification success of salivary interleukin-1β in periodontitis grading with artificial intelligence models: a cross-sectional observational study. Journal of Applied Oral Science, 33, e20240580. |
| [57] | Vanlalnunpuia, C., Kumar, V. A., Vanlalawmpuia, R., Khiangte, D. L., & Khan, A. K. (2025, February). Hybrid Feature Engineering and Sampling Strategies for Enhanced Diabetic Retinopathy Classification. In 2025 3rd International Conference on Intelligent Systems, Advanced Computing and Communication (ISACC) (pp. 787-792). IEEE. |
| [58] | Vasumathi, M. T., & Sadasivan, M. (2025). AI for Diseases Detection and Prevention. Artificial Intelligence and Cloud Computing Applications in Biomedical Engineering, 93. |
| [59] | Yasin, P., Ding, L., Mamat, M., Guo, W., & Song, X. (2025). Machine Learning-Based Interpretable Screening for Osteoporosis in Tuberculosis Spondylitis Patients Using Blood Test Data: Development and External Validation of a Novel Web-Based Risk Calculator with Explainable Artificial Intelligence (XAI). Infection and Drug Resistance, 2797-2821. |
| [60] | Zahra, A., Fauz, R., & Mufied, F. (2025, June). Explainable AI-Based Classification of Birth Methods In Rural Areas Using Random Forest: A Model Development Study. In 2025 4th International Conference on Electronics Representation and Algorithm (ICERA) (pp. 1-6). IEEE. |
| [61] | Zafar, M. M., Khan, Z. A., Javaid, N., Aslam, M., & Alrajeh, N. (2025, August). From Data to Diagnosis: A Novel Deep Learning Model for Early and Accurate Diabetes Prediction. In Healthcare (Vol. 13, No. 17, p. 2138). MDPI. |
| [62] | Zhu, T., Ghose, U., Climente-González, H., Howson, J. M., Hu, S., & Nevado-Holgado, A. (2025). Multimodal deep learning enhances genomic risk prediction for cardiometabolic diseases in UK Biobank. medRxiv, 2025-04. |