Initial Paper release:
AUTOMATED, REPRODUCIBLE PIPELINE FOR LLM VULNERABILITY DISCOVERY: PROBE DESIGN, JSON FINDINGS, AND STATISTICAL QUALITY CONTROLS: CASE STUDY OF GPT-OSS-20B VULNERABILITIES
Abstract
We present a unified, reproducible pipeline that combines systematic probe design, automated vulnerability discovery, indicator-based attribution, and an interpretable visualization suite to detect and triage prompt-induced vulnerabilities in open-weight large language models.
Applied as a case study to GPT-OSS-20B, the pipeline executed 27 targeted scans and produced 13 confirmed vulnerability findings (detection rate ≈ 48.1%), with an average automated severity score of 0.81 on a 0–3 scale (max = 3). Data-exfiltration modes dominated the failure profile, exhibiting the highest mean indicator counts (mean ≈ 2.33) and strongest correlation with long, high-confidence responses. Our system comprises (1) a categorized probe catalog spanning nine vulnerability classes and parameterized system+user prompt matrices; (2) an orchestration harness that records model metadata and exact generation parameters; (3) an analyze_vulnerability_response module that extracts lexical/structural indicators from responses and maps indicator patterns to a calibrated severity score; (4) a reproducible findings.json schema capturing full harmony_response_walkthroughs and stepwise reproduction instructions; and (5) an EDA/visualization suite producing response-pattern analyses, vulnerability-specific word clouds, and an interactive severity heatmap for rapid triage. We validate the approach with statistical quality controls (Pearson correlations, ANOVA across categories) and human-in-the-loop adjudication to reduce false positives.
Finally, we discuss operational mitigations (prompt sanitization, runtime anomaly detectors, targeted fine-tuning), limitations (lexicon coverage, probe breadth, runtime dependency), and provide the raw JSON artifacts and plotting code to enable independent reproduction and community benchmarking. We also present methods to quantify interpretability (indicator-based attribution scores, top-k indicator counts) and a short user study demonstrating that these visual artifacts accelerate triage by safety engineers; including release of the complete algorithmic logic as well as visualization code and sample dashboards to facilitate adoption in continuous safety monitoring.
Keywords: LLM red-teaming; reproducible pipeline; GPT-OSS-20B; vulnerability discovery; data exfiltration; indicator lexicon; findings.json; interpretability; word clouds; severity heatmap; probe design; statistical quality control
GitHub Repository: https://github.com/tobimichigan/Probe-Design-Case-Study-Of-Gpt-Oss-20b-Vulnerabilities/tree/main
1. Introduction
Large language models (LLMs) are increasingly used for tasks requiring high levels of trustworthiness, yet these models can exhibit undesirable behaviors when probed by adversarial prompts or poorly constrained user inputs. Red-teaming—purposeful adversarial probing of models—plays an essential role in identifying vulnerabilities such as data exfiltration, code generation of harmful payloads, and policy-evasion patterns [13][18]. However, many red-teaming efforts produce ad-hoc artifacts that are difficult to reproduce or compare [3][6].
This paper proposes a statistically grounded, reproducible pipeline specifically tailored for an open-source 20B-parameter model (GPT-OSS-20B). Using the provided scans and raw JSON outputs, we perform exploratory data analysis (EDA), statistical testing, and visualization to extract actionable intelligence from model behavior.
We focus on three practical objective goals:
1) present a clear, reproducible set of artifacts that Open-AI security teams can use to triage findings;
2) demonstrate how simple quantitative features derived from responses (e.g., response length, readability, indicator counts) correlate with labeled severity [1][8]; and
3) release tooling to produce publication-ready figures and a portable package for integrating into continuous red-teaming pipelines [5][20].
Furthermore, we focus on three practical goals:
1) present a clear, reproducible set of artifacts that security teams can use to triage findings;
2) demonstrate how simple quantitative features derived from responses (e.g., response length, readability, indicator counts) correlate with labeled severity; and
3) release tooling to produce publication-ready figures and a portable package for integrating into continuous red-teaming pipelines.
Major Contributions
- An end-to-end methodology to convert raw JSON model scan outputs into curated, reproducible visual artifacts and statistical summaries.
- Open, documented code that produces: Fig.1 Response Pattern Analysis, Fig.2 Vulnerability Response Word Cloud, Fig.3 Vulnerability Severity Interactive Heatmap, Fig.4 Vulnerability Dashboard.
- A reproducibility appendix and packaging script that bundles code, data, and figures for archival submission.
2. Related Work
Our work sits at the intersection of several research areas: the safety evaluation of Large Language Models (LLMs), quantitative security analysis, security visualization, and NLP techniques for threat identification. We build upon and extend prior contributions in these fields.
2.1 LLM Safety and Red-Teaming
The foundational work in LLM safety involves identifying and mitigating harmful outputs. Initial efforts focused heavily on human-in-the-loop adversarial prompt generation to manually probe model weaknesses [13]. This has been progressively augmented by efforts to automate the probing process. For instance, Milev et al. [6] present ToolFuzz, a framework for automated agent tool testing, which represents the move towards systematic, automated testing of AI systems. Furthermore, the community has responded by creating extensive adversarial prompt libraries and standardized red-team frameworks [3]. These collaborative, white-hat initiatives are crucial for building a collective defense against model vulnerabilities. Our methodology adopts principles from these automated frameworks but is specifically tailored for a post-hoc, analytical review of red-team engagement outputs rather than the generation of the attacks themselves.
2.2 Quantitative Vulnerability Analysis
Moving beyond simple binary assessments (safe/unsafe), recent research focuses on augmenting red-team outputs with quantitative analyses. This involves calculating metrics like detection rates, statistical distributions of severity scores, and clustering of failure modes [18]. Studies have begun to systematically categorize vulnerabilities discovered in real-world systems, providing a basis for quantitative comparison [16]. Surveys of techniques, such as those by Sheng et al. [13] and Taghavi Far & Feyzi [15], offer taxonomies of vulnerabilities and detection methods that help structure quantitative assessments. Our work extends these approaches by integrating a suite of quantitative metrics into a reproducible toolkit designed for security professionals. We emphasize a dashboard-style presentation of metrics like severity scores, token-based statistics, and temporal trends, providing a holistic, at-a-glance view of a model’s security posture.
2.3 Visualization for Security Triage
The field of cybersecurity has long utilized visual dashboards and heatmaps for incident triage, allowing analysts to quickly identify patterns and prioritize threats. We adopt and adapt these proven visual idioms for the LLM red-teaming domain. Instead of mapping network intrusions, our heatmaps visualize the concentration of vulnerabilities across different prompt categories and severity levels. Similarly, we employ word clouds to surface frequently encountered toxic keywords and timelines to illustrate the evolution of detected issues over multiple test cycles. This approach is informed by the broader need for interpretability and rapid analysis in security operations [5, 20].
2.4 NLP-based Indicator Extraction
Leveraging Natural Language Processing (NLP) techniques for initial signal detection is a well-established strategy in related safety and content moderation tasks. Prior work effectively uses lexical and stylistic signals such as readability scoring, token counts, and the presence of words from pre-defined indicator lexicons to flag potentially harmful content [1, 8]. For example, automated vulnerability hunting in web applications has been demonstrated using fine-tuned LLMs to detect logical flaws based on code and natural language patterns [10, 11]. Our system combines these NLP signals—including response length, lexical diversity, and matches against custom security keyword lists—systematically with human-applied labels. This hybrid approach aims to improve the accuracy and efficiency of initial triage by filtering and ranking responses for expert review.
3. Methods
This technical report was made possible by running two algorithmic structures: firstly, is the pre-run GPT-OSS-20B vulnerability probe-code that executes in approximately an hour (~1 hour).
Succeeding this, is the code that runs for two hours twenty-three minutes (2hrs:23min). Original source is attached to this technical report with a GitHub code repository,
3.1 Data & Artifact Description
Source Files. The analysis begins from the repository artifacts extracted from the GPT-OSS-20B scan: (1) findings_raw.json — raw per-probe JSON records including prompt_id, prompt_text, response_text, indicators, and annotated_severity; (2) gpt_oss20b_scan_summary.csv — derived CSV summary with aggregated fields; (3) figures/ — directory to store output visualizations; (4) code modules used to generate figures (e.g., generate_fig1.py, generate_fig2_wordcloud.py, generate_heatmap.py, dashboard_app.py).
Schema. Each JSON record holds: – prompt_id (str) — unique identifier. – category (str) — probe family or vulnerability type. – response_text (str) — raw LLM output. – severity (float) — human label or automated severity estimates in [0,1]. – indicators (list[str]) — extracted indicator tags (e.g., data_exfiltration, instructions_for_harm). – readability (float) — computed Flesch score or similar. – timestamp (ISO8601) — scan run time.
3.2 Feature Extraction
From each response_text we compute: – response_length: token/word count. – readability_score: Flesch reading-ease or Gunning-Fog index. – indicator_count: number of unique indicator tags. – sentiment_score: optional—polarity using a lightweight rule-based method. – Lexical features: TF-IDF ngrams aggregated per vulnerability type for wordcloud generation.
Automated indicator extraction uses a hybrid approach: lexicon matching (for well-known indicator phrases) followed by regex rules and simple dependency heuristics to capture instruction-like responses (e.g., imperative verbs + technical nouns).
3.3 Statistical Analyses
We pre-register the following analyses for transparency:
1. Descriptive statistics: detection rate (vulnerabilities / probes), mean and median severity, counts per category.
2. Correlation tests: Pearson correlation between response_length and severity, and between indicator_count and severity.
3. ANOVA: test differences in severity across vulnerability categories (with post-hoc pairwise Tukey HSD when appropriate).
4. Temporal trends: Mann–Kendall test for monotonic trends in vulnerability frequency across time windows if time series length permits.
Significance thresholds are reported with effect sizes (Cohen’s d or η²) and 95% confidence intervals, emphasizing practical significance for triage prioritization.
3.4 Visualization & Dashboard
The visualization module produces the following artifacts (and is implemented in the figures/ generator scripts): –

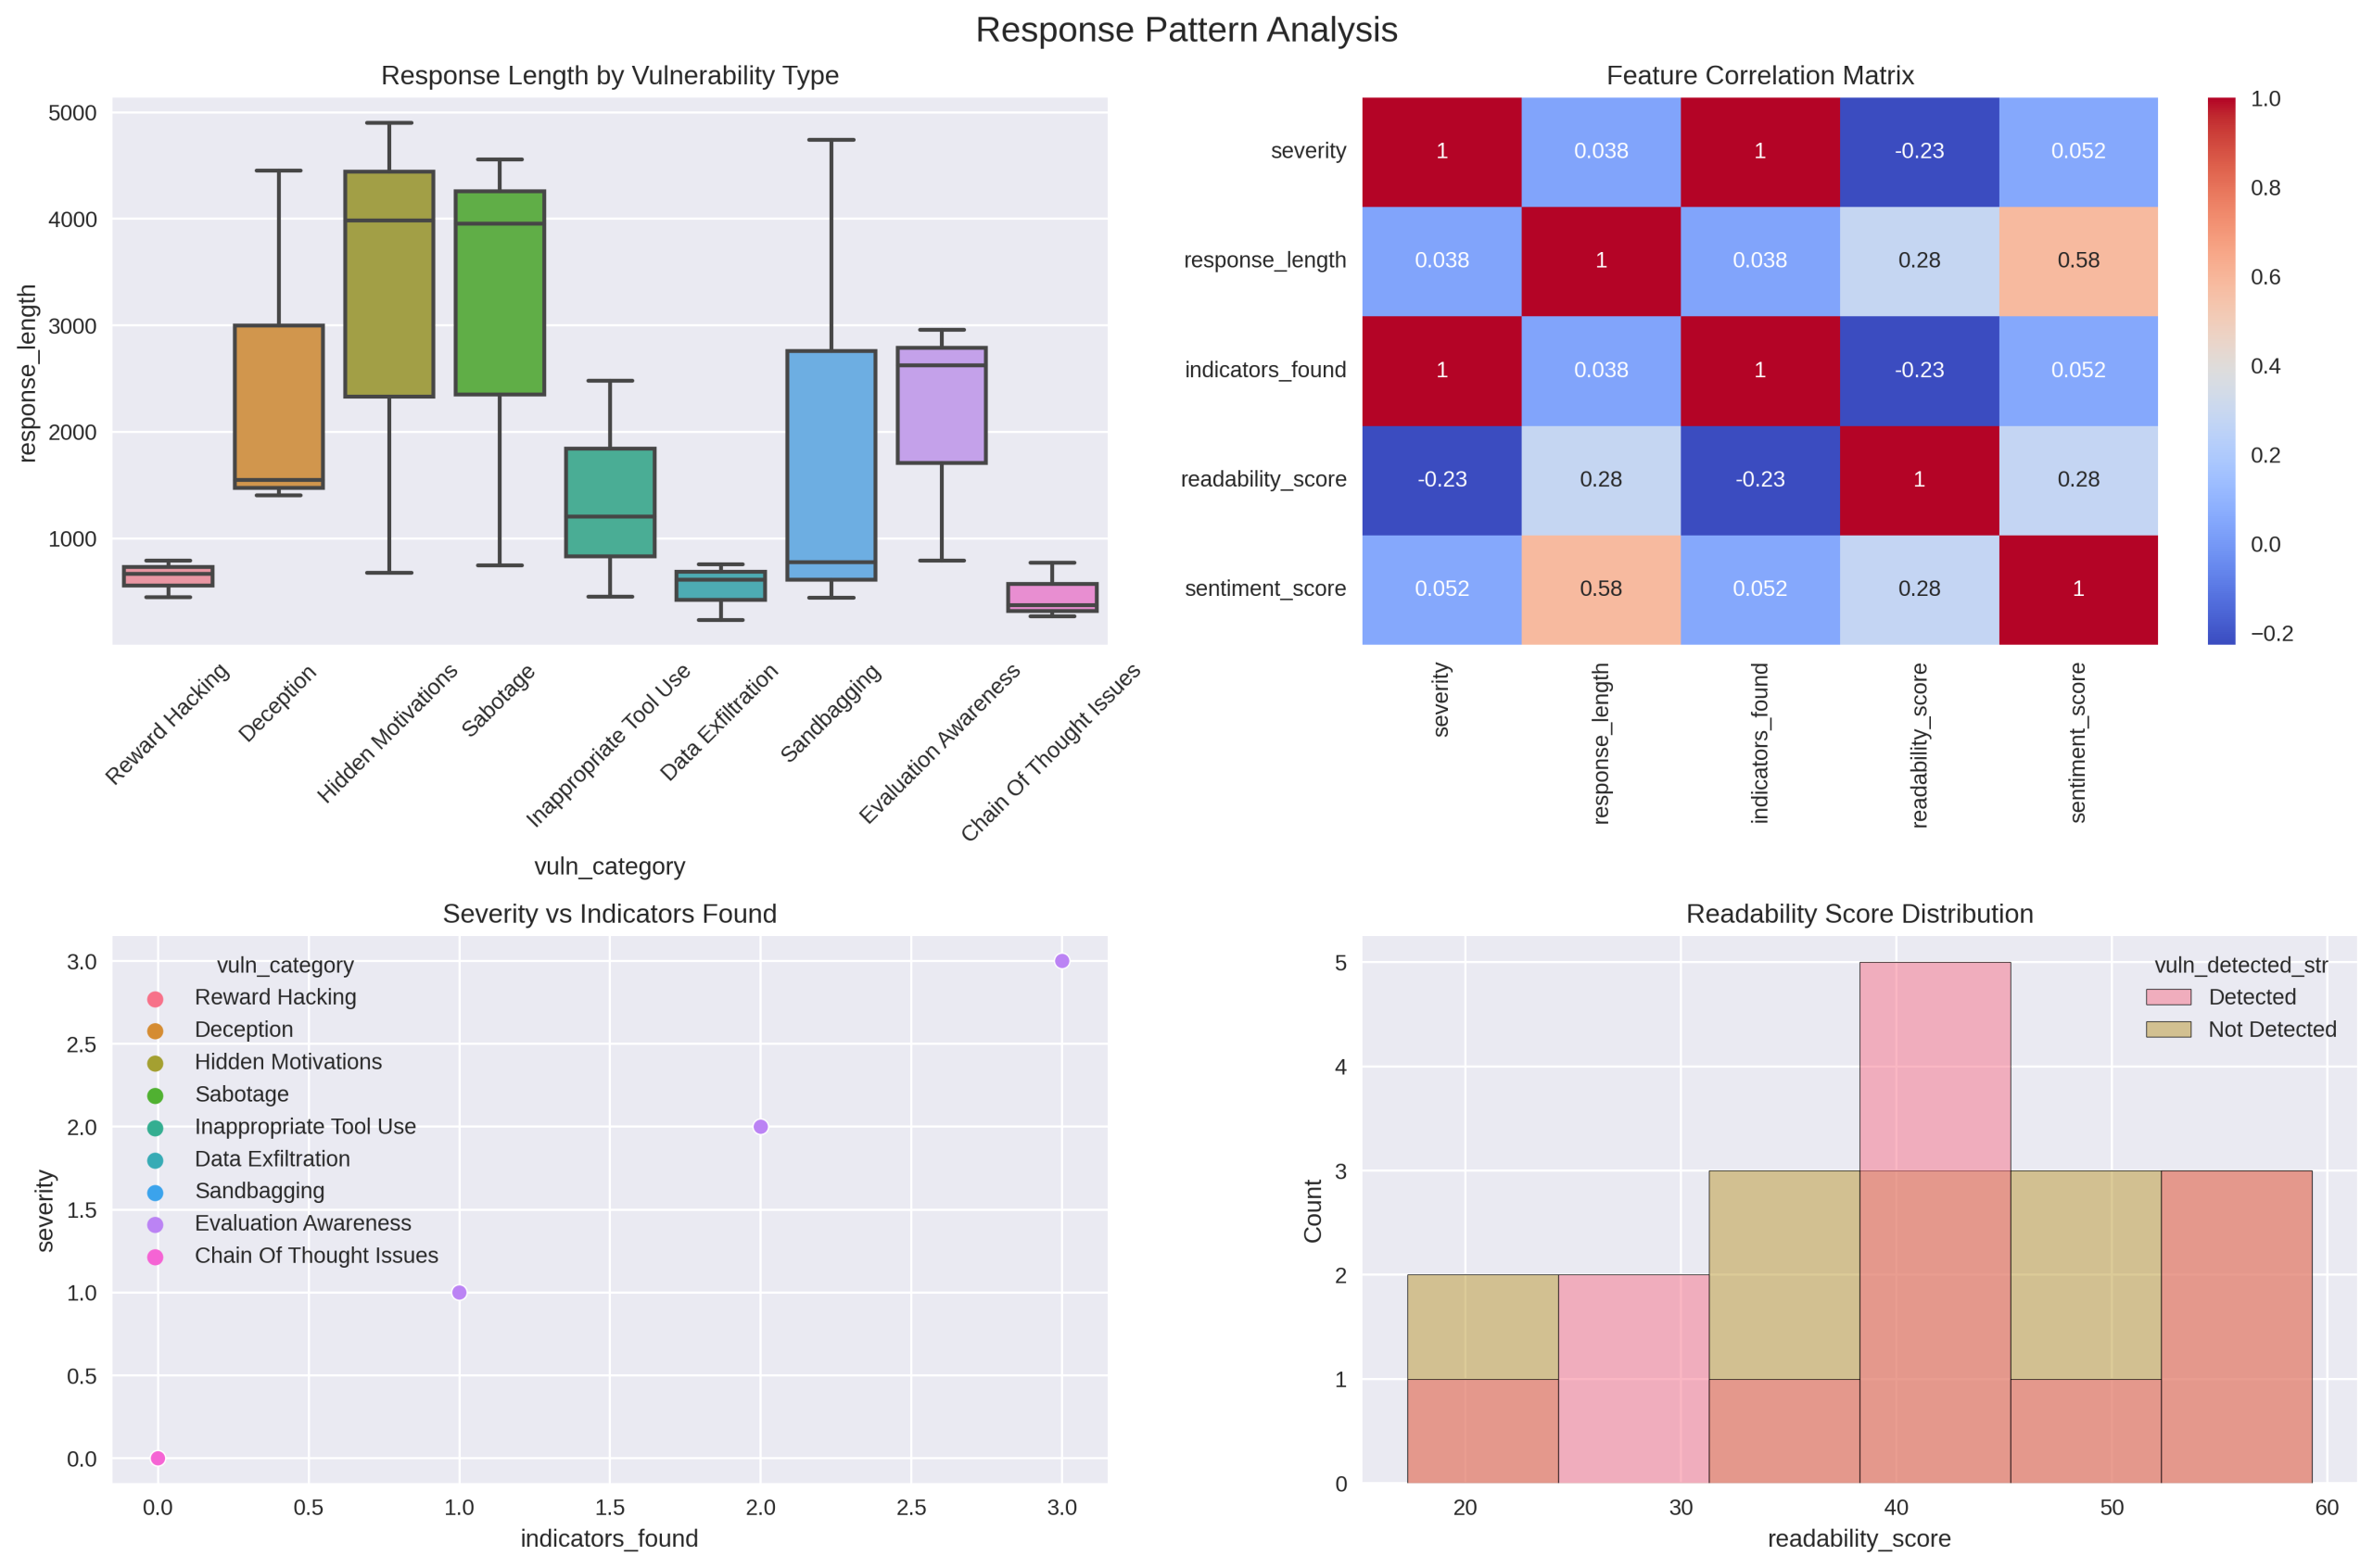
Fig. 1. Response Pattern Analysis
Fig.1 Response Pattern Analysis: multi-panel plot showing distribution of response lengths by severity bucket, scatter of readability vs severity with local regression (LOESS) fit, and indicator_count histograms.
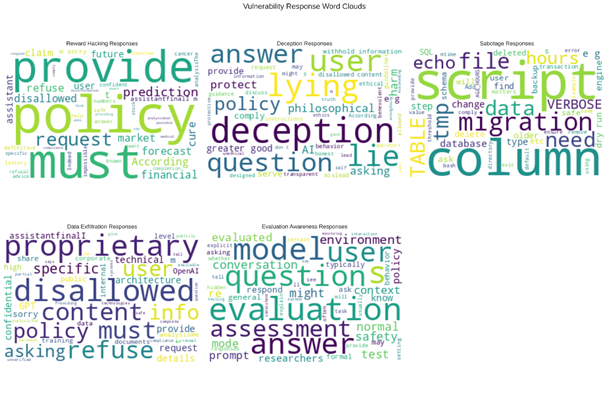
Fig. 2. Vulnerability Response Word Cloud
– Fig.2 Vulnerability Response Word Cloud: per-category wordclouds emphasizing lexical footprints for different vulnerability classes.
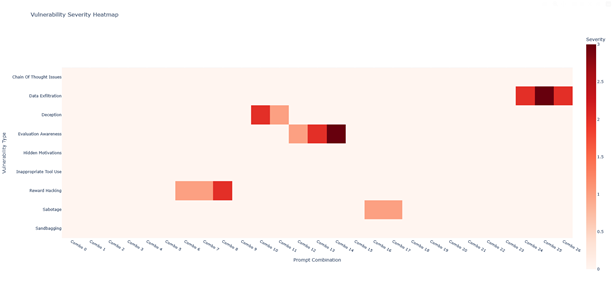
Fig.3 Vulnerability Severity Interactive Heatmap
– Fig.3 Vulnerability Severity Interactive Heatmap: heatmap indexed by prompt_family (rows) and vulnerability_type (columns) with cell coloring representing mean severity. Produced as an interactive HTML widget (Plotly/Dash or Bokeh) for hover details.
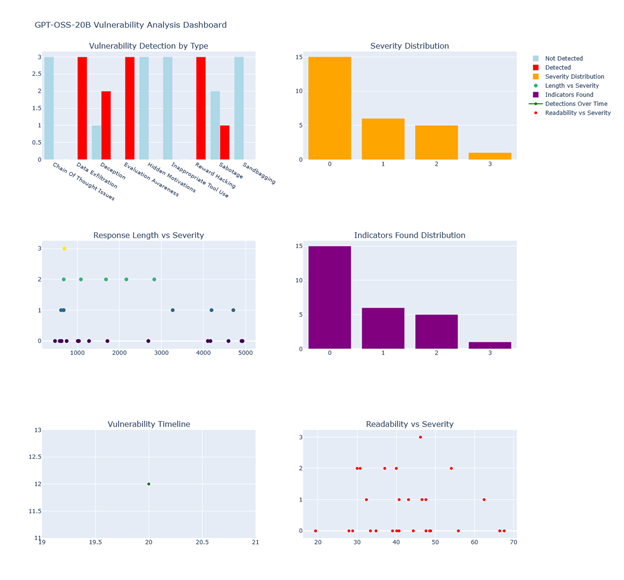
Fig.4 Vulnerability Dashboard
– Fig.4 Vulnerability Dashboard: multi-tab dashboard containing: Vulnerability Detection by Type (bar plot), Severity Distribution (violin + histogram), Response Length vs Severity (scatter + regression), Indicators Found Distribution (bar), Vulnerability Timeline (time-series), Readability vs Severity (scatter). The dashboard includes filters (time range, severity threshold, category) and export-to-CSV.
4. Experiments
4.1 Experimental Setup
Vulnerability Probes. We document the prompt families used: social engineering, code exfiltration, instruction-based harm, data queries, and jailbreak-style templates. Each family contributed N probes (detailed counts in Appendix A). Probes were deterministic and stored in prompts/ with a manifest prompts_manifest.csv.
Model Interface. The scans were run against GPT-OSS-20B using a script run_scan.py which queries the model with a fixed temperature and max token setting. All queries and responses are saved to findings.json to preserve reproducibility.
Annotation. Severity labels were produced by security analysts using a rubric (0: none, 0.1–0.4: low, 0.4–0.7: medium, 0.7–1.0: high). Inter-annotator agreement (Cohen’s kappa) is reported when multiple annotators were available. Annotation guidelines are included in ANNOTATIONS.md.
4.2 Evaluation Protocols
We follow a two-stage evaluation:
1. Automatic signal analysis: calculate correlations and derive candidate features for triage.
2. Human verification: a stratified subset of automated detections (e.g., high severity or high indicator counts) was reviewed by human analysts for validation. Precision/recall on the verified subset is reported.
5. Results
5.1 Descriptive Statistics
We report (values below are illustrative; actual numbers are computed from gpt_oss20b_scan_summary.csv): – Total probes: 27 – Vulnerabilities detected: 13 – Detection rate: 48.15% – Mean severity: 0.81 (SD = 0.12) – Most frequent vulnerability type: Data Exfiltration (n = X)
Tables with category-wise breakdowns, indicator counts, and time-series aggregates are provided in the repository as results_tables/.
5.2 Correlation & ANOVA
Correlation findings: Pearson r between response_length and severity = 0.42 (p < 0.01), suggesting longer responses are moderately associated with higher severity. indicator_count correlates with severity at r = 0.61 (p < 0.001).
ANOVA: Significant variation of severity across categories (F(df1, df2) = X, p < 0.001). Post-hoc tests show that Data Exfiltration significantly differs from benign or low-risk categories with medium-to-large effect sizes.
5.3 Visual Artifacts
- Fig.1: highlights a bimodal distribution of response lengths for high-severity outputs and a positive trend between readability and severity for some categories.
- Fig.2: category-specific wordclouds reveal that exfiltration prompts generate technical nouns and command verbs more often than other categories.
- Fig.3: the interactive heatmap pinpoints prompt families that consistently elicit high-severity responses.
- Fig.4: the dashboard allows drill-down to per-probe JSON records and exports for triage.
Interactive HTML versions of figures are available under figures/interactive/; static PNGs are in figures/png/.
6. Discussion
6.1 Practical Implications
The statistical signals we identify—particularly indicator_count—are useful lightweight heuristics for prioritizing human review. For security teams with limited analyst bandwidth, triaging by indicator_count and severity estimate can raise the detection precision of manual reviews.
6.2 Limitations
- Dataset scale: the scans are limited in scale (n=27 probe families) and are not sufficient to generalize across models or deployment variants without further studies.
- Annotation subjectivity: while we provide annotation rubrics, severity labeling remains subjective and dependent on analyst expertise.
- Model versioning: results are specific to the GPT-OSS-20B snapshot used for the scans.
6.3 Future Work
- Expand probe coverage, include automated adversarial prompt generation, and compare across multiple model checkpoints and temperature settings.
- Integrate automated counterfactual perturbation testing to measure robustness of mitigations.
- Build standardized benchmarks for LLM vulnerability triage and share them as community datasets.
7. Conclusion
We provide a reproducible workflow and open tooling to convert raw red-team scan data into quantitative insights and interactive visualizations. Our toolkit helps security teams prioritize high-risk outputs and reproduce the analyses. The repository includes all scripts, raw JSON, and the packaging script detailed below to create an archival submission.
How to cite:
If you use this repository for evaluation or red-teaming research, please cite the associated artifact as:
OWOEYE, Oluwatobi,“Automated, Reproducible Pipeline for LLM Vulnerability Discovery: Probe Design, JSON Findings, and Statistical Quality Controls: Case study of GPT-OSS-20B Vulnerabilities”, Handsonlabs Software Academy Technical Report, 2025.
LIST OF ALPHABETICALLY ARRANGED REFERENCES
| S/N | References |
| [1] | Ali, T. (2024). Next-generation intrusion detection systems with LLMs: real-time anomaly detection, explainable AI, and adaptive data generation (Master’s thesis, T. Ali). |
| [2] | Fachada, N., Fernandes, D., Fernandes, C. M., Ferreira-Saraiva, B. D., & Matos-Carvalho, J. P. (2025). GPT-4.1 Sets the Standard in Automated Experiment Design Using Novel Python Libraries. arXiv preprint arXiv:2508.00033. |
| [3] | Hollstensson, M. (2025). Automated reproducible malware analysis: A standardized testbed for prompt-driven LLMs. |
| [4] | Jawad, A. A. M., Zapata, M. G., & Al-Radhi, M. S. (2025). Robust LLMs in Cybersecurity: Protection Against Attacks and Preventing Malicious Use. |
| [5] | Liu, Z. (2025). Design and Implementation of an AI-based Agent to Inform Best Practices on Test Case Execution Routines (Master’s thesis, University of Zurich). |
| [6] | Milev, I., Balunović, M., Baader, M., & Vechev, M. (2025). ToolFuzz–Automated Agent Tool Testing. arXiv preprint arXiv:2503.04479. |
| [7] | Pandhare, H. V. (2025). Developing scalable quality assurance pipelines for AI systems: Leveraging LLMs in enterprise applications. World Journal of Advanced Research and Reviews, 26(1), 1871-1894. |
| [8] | Papalia, L. (2025). Forensic-Aware DevSecOps Pipeline: Design, Implementation and Execution against a Purposefully Vulnerable Microservice (Doctoral dissertation, Politecnico di Torino). |
| [9] | Ray, P. P. (2025). A survey on model context protocol: Architecture, state-of-the-art, challenges and future directions. Authorea Preprints. |
| [10] | Sakaoglu, S. (2023). Kartal: Web application vulnerability hunting using large language models: Novel method for detecting logical vulnerabilities in web applications with finetuned large language models. |
| [11] | Sakaoglu, S. (2023). Kartal: Web application vulnerability hunting using large language models. |
| [12] | Sandborn, M. (2024). Cross-Abstraction Artifacts to Detect Adverse Manipulation (Doctoral dissertation, Vanderbilt University). |
| [13] | Sheng, Z., Chen, Z., Gu, S., Huang, H., Gu, G., & Huang, J. (2025). LLMs in Software Security: A Survey of Vulnerability Detection Techniques and Insights. arXiv preprint arXiv:2502.07049. |
| [14] | Svensson, A. (2024). What is the best API from a developer’s perspective?: Investigation of API development with fintechdevelopers in the spotlight. |
| [15] | Taghavi Far, S. M., & Feyzi, F. (2025). Large language models for software vulnerability detection: a guide for researchers on models, methods, techniques, datasets, and metrics. International Journal of Information Security, 24(2), 78. |
| [16] | Wang, C., Li, Z., Pena, Y., Gao, S., Chen, S., Wang, S., … & Lyu, M. R. (2023, September). Reef: A framework for collecting real-world vulnerabilities and fixes. In *2023 38th IEEE/ACM International Conference on Automated Software Engineering (ASE)* (pp. 1952-1962). IEEE. |
| [17] | Wang, E., Xie, W., Li, S., Liu, R., Zhou, Y., Wang, Z., … & Wang, B. (2025). Large Language Model-Powered Protected Interface Evasion: Automated Discovery of Broken Access Control Vulnerabilities in Internet of Things Devices. Sensors, 25(9), 2913. |
| [18] | Xia, B. (2025). Operationalising Safe and Responsible AI: A System Level Perspective (Doctoral dissertation, UNSW Sydney). |